In this crypto marketing ROI benchmark, across 150 or more completed campaigns run between January 2024 and February 2026, the median net return was 2.8x within a 90-day window. The range by project type runs from 1.4x to 7.0x, and 12 percent of campaigns are counted as failures inside that median rather than filtered out of it. This is the benchmark, the method behind it, and the single factor that moved results more than budget did.
Key Takeaways
- Median net ROI is 2.8x within 90 days, not an average, because averages in crypto are distorted by a handful of outliers.
- Launch-date clarity moved results more than any other variable: 3.1x with a confirmed date against 1.4x without.
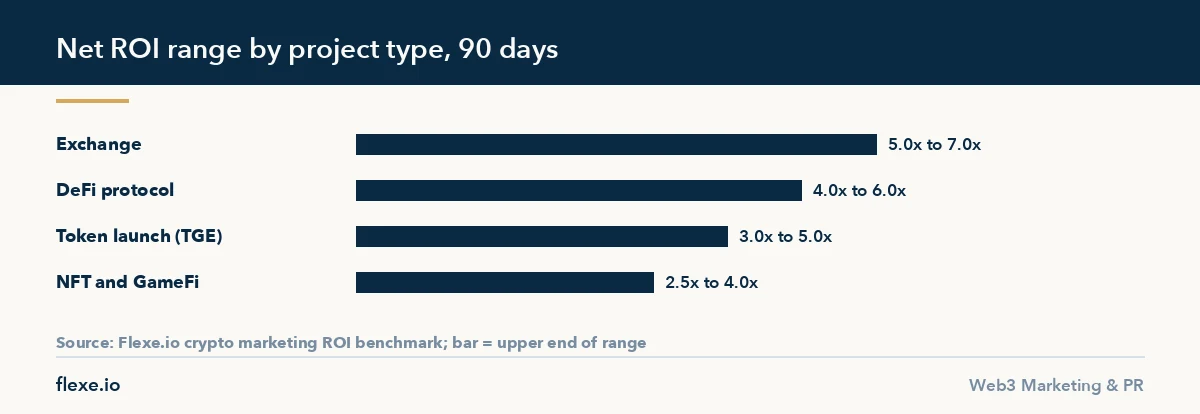
- Exchanges returned the most (5.0x to 7.0x), NFT and GameFi the least (2.5x to 4.0x).
- The 12 percent failure rate stays inside the median. Removing it would lift the headline figure and make it useless.
- A benchmark is a reference point, not a forecast. It tells you what is normal, not what you will get.
What exactly was measured in the crypto marketing ROI benchmark?
Net return over a 90-day window from campaign start, across more than 150 completed campaigns between January 2024 and February 2026. Net rather than gross, meaning campaign spend is deducted before the multiple is calculated.
Three sources are combined. UTM analytics for attributed traffic and conversions, on-chain data through Dune Analytics for wallet-level outcomes that never touch a UTM parameter, and structured interviews with more than 40 clients to catch results neither source records.
The 90-day window is a deliberate constraint. It is long enough for a launch to play out and short enough that a project can hold a supplier to it, and it excludes the long tail that makes any campaign look successful eventually.
Why report a median rather than an average?
Because crypto campaign outcomes are not normally distributed. One campaign that catches a market cycle can return an order of magnitude more than the rest, and an average that includes it describes nothing that a new project should expect.
A median answers the question a buyer is actually asking, which is what happens in the middle rather than what happened at the top. Any agency quoting an average, or quoting a single case study as a typical outcome, is answering a different question.
How does return vary by project type?
By a factor of nearly three between the highest and lowest categories. The differences reflect how directly marketing spend connects to a measurable financial action.
| Project type | Net ROI range, 90 days | Why |
|---|---|---|
| Exchange | 5.0x to 7.0x | A signup and a first trade are immediate and directly attributable |
| DeFi protocol | 4.0x to 6.0x | Deposits are on-chain and measurable, though retention varies widely |
| Token launch (TGE) | 3.0x to 5.0x | Concentrated around a date, with little room to correct a bad start |
| NFT and GameFi | 2.5x to 4.0x | Purchase intent is discretionary and the audience is the least predictable |
Read these as ranges rather than targets. A project at the bottom of its category range has not necessarily been failed by its agency, and one at the top has not necessarily been served better.
What moved results more than budget?
A confirmed launch date. Campaigns with a specific date within a two-week tolerance returned a median 3.1x. Campaigns without one returned 1.4x, a difference of roughly 140 percent, and it held across project types and budget levels.
The mechanism is not mysterious. A date lets every channel converge: PR can be embargoed to it, creators can be scheduled against it, community activity can build toward it. Without a date, each channel fires independently and the audience never assembles in one place at one time.
The practical implication is uncomfortable for most projects. Postponing a campaign until the date is real produces better returns than starting on schedule without one, and almost nobody does it.
Why publish a failure rate at all?
Because a median calculated only on successful campaigns is not a median. Twelve percent of the campaigns in this set did not reach their target, and those campaigns sit inside the 2.8x figure rather than beside it.
Removing them would produce a higher headline number and a less useful one. It would also be undetectable from outside, which is precisely why benchmarks published without a failure rate should be read with suspicion. The question to ask any agency quoting a return multiple is simple: how many campaigns are in the denominator, and did the ones that failed stay in it.
What this crypto marketing ROI benchmark does not tell you
It is not a forecast, and it is not a guarantee. It describes what happened to a set of campaigns run by one agency in a specific market period, and market conditions between January 2024 and February 2026 will not repeat.
It is also first-party data rather than an independently audited industry study. We compiled it from our own campaign records, which means it is verifiable against our methodology and not against anyone else’s. Treat it as a reference point for what normal looks like, and use it to interrogate the numbers other suppliers quote rather than as a promise about your own project.
The ROI calculator models the same variables against a specific project, and our methodology page sets out how the underlying data is collected and reviewed.
Applying the crypto marketing ROI benchmark
A reference point is only usable if your own measurement is built the same way. Before a campaign starts, write down the window you will judge it over, what counts as a conversion, and whether spend is deducted before the multiple is calculated. Those decisions are trivial to make in advance and impossible to make honestly afterwards, when the results are visible and every definition starts to look negotiable.
Fix the denominator at the same time. A multiple calculated across every channel that ran is a different figure from one calculated across the channels that worked, and the second is the one most reports quietly present. Decide that each channel booked stays in the count whatever it produces, note it in the brief, and the number you end up with will be comparable with the one above.
Then decide what the number will be used for. A benchmark works as a filter on claims and as a sanity check on a plan, and it fails as a target to be hit, because the fastest route to a high multiple is a narrow definition rather than a better campaign. Teams that judge a quarter by a single multiple usually get the multiple and lose the growth it was supposed to represent.
Set up measurement before the first booking
The tracking has to exist before money moves, because attribution cannot be reconstructed from memory. Agree a naming convention for campaign links and make one person responsible for issuing them, so that every placement gets its own link and no two are named the same way. Placements booked by a supplier need links issued by you, otherwise the only record of what ran will be the supplier’s own report.
Decide how wallet level outcomes will be read, since the actions that matter most often never touch a link. That means agreeing in advance which contract events count, which addresses are excluded, and over what period a wallet is attributed to a campaign. Building the query before launch also tells you whether the question is answerable at all, which is cheaper to discover then than at the end of the window.
What belongs in the contract
Deliverables should be written per channel and in units someone can count: the number of placements, where they run, what shape they take and when they go live. A retainer that promises effort rather than output cannot be checked at the end of the window, and the end of the window is the only place a return multiple can be settled. Ambiguity there always resolves in the supplier’s favour.
Tie payment to those deliverables rather than to a calendar, and keep the final portion until reporting is delivered in the format agreed at the start. Ownership matters as much as money: ad accounts, pixels, analytics and the raw data behind reports should be yours during the engagement, not handed over afterwards. Suppliers who decline that are telling you something about what the reports will contain.
Put the launch date into the agreement as a condition rather than a wish. The data above says a confirmed date separates a median of 3.1x from 1.4x, which means the right clause is one that pauses the campaign if the date moves, instead of spending against a schedule that no longer exists. Agree what happens to booked placements in that case before anything is booked.
Reporting cadence belongs in the same clause. Weekly numbers in a shared file beat a polished deck at the end, both because problems surface while they can still be fixed and because a file accumulates into the series you need for the next campaign. State the fields you expect, and state that raw exports accompany any chart. A chart without the rows behind it cannot be checked.
Reviewing while the window is open
A 90-day window is short enough to be checked and long enough to correct. Read the results at the midpoint against what was planned, channel by channel, and look at cost per outcome rather than at impressions. Channels that are clearly not converting should be stopped rather than optimised, and the money moved to the ones that are. That decision is the difference between a reported result and a real one.
Resist changing the definitions during that review. Moving the window, adding a channel to the denominator or switching from net to gross are all easy to justify mid-flight and they destroy the comparison you set out to make. Keep a note of anything you did change, since a benchmark compiled from campaigns measured different ways is exactly the kind of figure this page argues against.
Keep a short written log of what changed each week and why. Campaigns are rarely explained by a single decision, and months later nobody remembers which week the creative changed or when a channel was paused. The log is what turns one campaign into evidence you can use on the next one, which is the only way an internal benchmark of your own ever gets built.
Where measurement usually goes wrong
The most common failure is double counting. Several channels claim the same conversion, each report is correct on its own terms, and the sum exceeds what actually happened. Pick one attribution rule before launch and apply it to every channel, including the ones a supplier reports separately. The rule can be imperfect. It cannot be different per channel and still produce a number worth comparing.
The second is reporting gross returns as net, which inflates a multiple by exactly the size of the spend and is usually presented without any intent to mislead. The third is comparing a multiple against a category it does not belong to, since ranges here differ by project type by nearly a factor of three. Ask which category a quoted figure came from before treating it as a target.
The fourth is silent survivorship. A campaign stopped early, a channel cancelled after a week, or a client relationship that ended before the window closed all disappear from most reporting, and every one of them belonged in the denominator. Keep a list of what was booked at the start and reconcile the final report against that list rather than against what the report chooses to include.
What to ask a supplier
Before signing, ask for the window, the denominator and the failure rate behind any multiple quoted at you, and ask how attribution was decided. The answers matter less than whether they arrive as specific figures or as adjectives. Then ask for one campaign that missed its target and what was done about it. A supplier with real records can answer that immediately, without treating the question as hostile.
Frequently asked questions
Is 2.8x a good return for crypto marketing?
It is the middle of this data set rather than a standard. Whether it is good depends on margin: a protocol whose depositors stay for a year values a multiple differently from a collection selling once. Compare it against what the same spend would return elsewhere in the business.
Why 90 days rather than a longer window?
Because a longer window makes almost any campaign look successful and removes the supplier’s accountability. Ninety days is long enough for a launch to resolve and short enough to be checked.
Does a bigger budget produce a higher multiple?
Not proportionally. Larger budgets buy more absolute reach, but the multiple flattens as the most efficient channels saturate. Launch-date clarity moved the multiple further than budget size did across this data set.
How can a buyer verify a benchmark like this?
Ask for the denominator, the window and the failure rate. An agency that can state how many campaigns are counted, over what period, and what share missed target is describing a real data set. One that cannot is describing a selection of good outcomes.
Where to go next
For the placement side of the same data, see our study of 195 crypto PR outlets. For how the channels that produce these returns fit together, see how the channels behind these returns fit together.
Want the benchmark applied to your project rather than to a median? Send the brief on Telegram at https://t.me/flexe_io_agency and we will come back with a channel mix and a target range within 24 hours.
Nothing here is financial advice. Figures are first-party data from our own campaign records for January 2024 to February 2026 and are not an independently audited industry benchmark. Past campaign results do not predict future ones.