Hedge Fund Marketing Deck: 2025 Guide with Real Numbers
Most articles about pitch decks for hedge funds recycle the same generic advice. This one doesn’t. You’ll find real systems, actual performance data, and specific numbers from fund managers who track what works.
Key Takeaways
- A hedge fund marketing deck is a compliance-ready presentation that communicates your investment thesis, track record, and risk framework to accredited investors and institutional allocators.
- Automated deck creation systems now generate investor-grade presentations in 12 minutes at $0.87 per deck, compared to 3 weeks of manual work or $3,000–$5,000 agency fees.
- The most effective decks include real-time performance dashboards that update metrics like ROAS, cost per acquisition, and portfolio gains automatically, eliminating decisions based on stale data.
- Fund managers who visualize realized gains and losses by expiration date and strategy (as one manager did for $87 million in August expirations) give investors clear insight into performance drivers.
- Common mistakes include burying the investment thesis on slide seven, using generic competitor analysis, and failing to show how you’ll deploy capital in the first 90 days.
- Compliance failures stem from overstating historical returns, omitting risk disclosures, or using testimonials without proper disclaimers—all of which can delay fundraising by months.
- The best decks combine narrative storytelling with data visualization: one client increased decision-making speed from 6 hours weekly to 10 minutes daily by switching to live dashboards.
Introduction
A hedge fund marketing deck is the single most scrutinized document in your fundraising process. Institutional investors and family offices will dissect every claim, question every assumption, and compare your thesis against dozens of competitors. The reality is: most decks fail because they bury critical information, lack verifiable performance data, or read like generic templates that every other emerging manager is using.
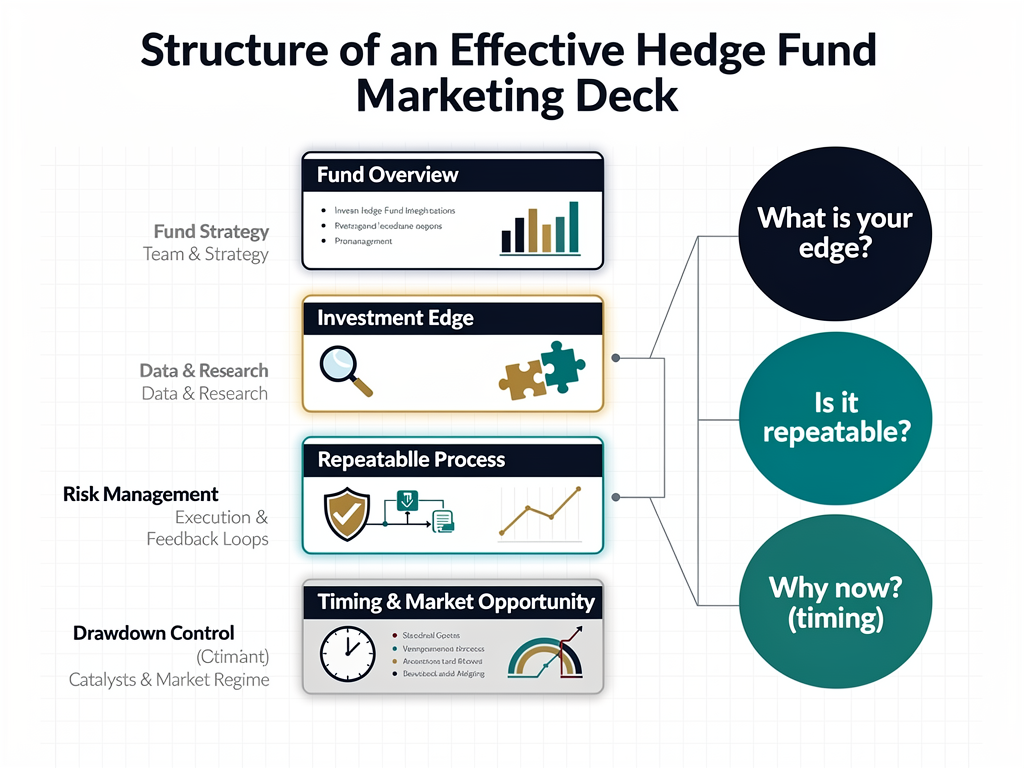
Here’s what matters: your deck must answer three questions in the first five slides—what’s your edge, how repeatable is it, and why now? Everything else supports that narrative. Investors don’t have patience for 40-slide presentations that meander through macroeconomic theory before revealing your actual strategy on slide 23. They want proof of concept, a clear risk framework, and evidence that you can execute under pressure.
Recent implementations show that automation and real-time data visualization are transforming how managers build and present these materials. One system using AI workflows generates investor-grade decks in 12 minutes with built-in market research, while fund performance dashboards with 10,000+ lines of Python code break down $87 million in realized gains by strategy and expiration. These aren’t theoretical concepts—they’re working tools that eliminate weeks of manual PowerPoint work and give allocators the transparency they demand.
What is a Hedge Fund Marketing Deck: Definition and Context
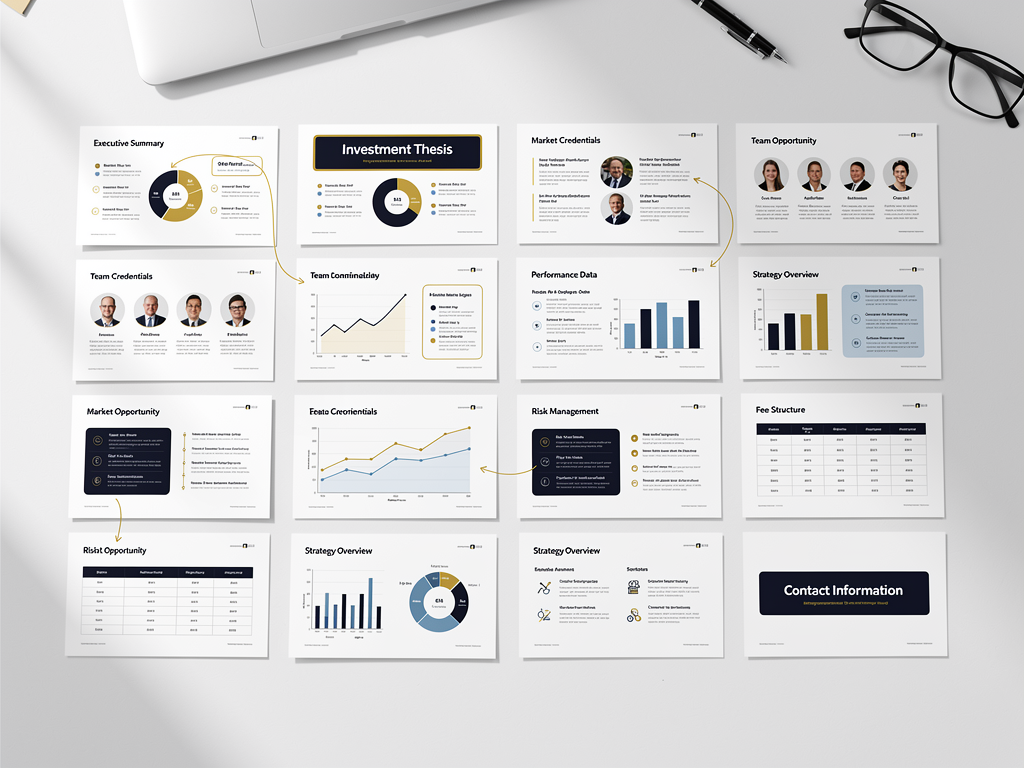
A pitch deck for a hedge fund is a structured presentation—typically 15 to 25 slides—that communicates your investment strategy, team credentials, historical performance (if any), risk management protocols, fee structure, and regulatory compliance to potential limited partners. Unlike a corporate pitch deck, this document must satisfy both marketing and legal requirements. You’re not just selling a vision; you’re making specific, verifiable claims about how you’ll manage other people’s capital.
Current data demonstrates that institutional allocators spend an average of 4 to 7 minutes on initial deck review. If your thesis isn’t crystal clear by slide three, you’re out. Modern presentations integrate live performance metrics, third-party verified track records, and interactive data visualizations that let investors drill into portfolio composition, factor exposure, and drawdown analysis. Today’s blockchain and fintech leaders are embedding real-time dashboards directly into their pitch materials, showing exactly how capital is deployed and how risk is monitored 24/7.
This document is for emerging managers raising their first institutional fund, established managers launching new strategies, and fund marketers tasked with converting high-net-worth individuals into committed LPs. It’s not for retail investors (who face different regulatory constraints) or venture capital funds (which use entirely different performance metrics and timelines). If you’re targeting accredited investors under Regulation D or institutional allocators with $10 million-plus minimums, this guide applies to you.
What These Presentations Actually Solve
The first problem is trust at scale. Institutional allocators receive hundreds of decks every quarter. Most are indistinguishable. A strong presentation cuts through the noise by leading with verifiable, third-party audited performance data and clear attribution of returns to specific strategies. One manager tracking yieldmax trading data built a summary view that breaks down realized gains by expiration date and strategy—showing, for example, exactly how $87 million in August expirations split between synthetic and weekly positions. That level of granularity proves you know where your alpha comes from.
Second is differentiation in crowded markets. Generic competitor slides that list “BlackRock, Citadel, Two Sigma” as benchmarks tell investors nothing. Effective decks show how your edge is structural, repeatable, and defensible. They include case studies with concrete outcomes: before-and-after snapshots of portfolio optimization, risk-adjusted return improvements, or cost reductions achieved through proprietary models. For instance, one AI-driven system for operational efficiency delivered 20% productivity gains (213,000 hours saved annually) and $100 million in trading cost savings with 95% decision accuracy—metrics that instantly communicate execution capability.
Third is compliance and risk transparency. Allocators need to see that you understand regulatory constraints, have documented risk management protocols, and won’t blow up the fund chasing outsized returns. This means including detailed sections on concentration limits, liquidity management, counterparty risk, and worst-case drawdown scenarios. Managers who bury or omit this material signal either inexperience or recklessness.
Fourth is time efficiency in fundraising. Manual deck creation consumes weeks of senior team bandwidth. One automated workflow using Claude, n8n, and Gamma reduced deck generation from 3 weeks of manual PowerPoint work to 12 minutes, at a cost of $0.87 per deck versus $3,000 to $5,000 for agency-built templates. That system collects company briefs, conducts TAM/SAM/SOM analysis, builds go-to-market strategy, auto-generates the presentation, exports to Drive, and logs outputs for iteration—all without human oversight. For managers running lean operations, that kind of leverage is transformative.
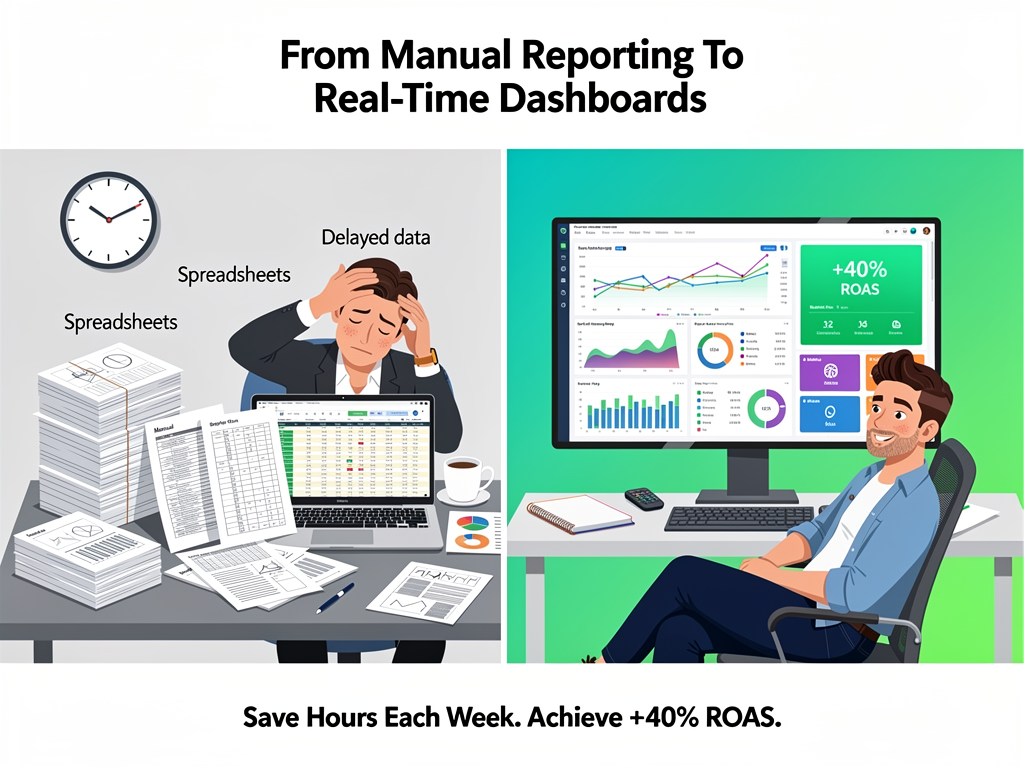
Fifth is decision-making speed for allocators. Investors don’t want static PDFs; they want interactive dashboards that let them explore your data. One client managing $940,000 in monthly ad spend built a real-time monitoring system that tracks spend, sales, ROAS, and cost per acquisition automatically. Before the dashboard, the team spent 6 hours weekly pulling manual reports and made decisions on 2-day-old data. After implementation, they review live insights in 10 minutes daily, catch performance issues within hours, and optimize budget allocation in real time. The result: 40% ROAS increase in the first month, driven entirely by visibility, not creative changes.
How This Works: Step-by-Step
Step 1: Define Your Investment Thesis in One Sentence
Your thesis must be specific, falsifiable, and tied to a market inefficiency you can exploit repeatedly. “We generate alpha through quantitative strategies” is meaningless. “We capture mispricings in volatility surfaces during earnings season using proprietary options flow data” is actionable. Write this sentence first, then build every slide to support it. If your team can’t articulate the thesis in under 20 words, allocators won’t understand it either.
One fund manager using automated market research tools collects five strategic inputs via a form trigger, then runs TAM/SAM/SOM analysis and competitive intelligence to validate the thesis. This front-loads the strategic work and ensures the deck opens with a data-backed claim, not a hypothesis.
Step 2: Structure Your Narrative Around Proof Points
Slide order matters. Open with the thesis and a one-slide track record summary (even if it’s a personal account or simulated performance, clearly labeled). Follow with team bios that highlight domain expertise directly relevant to the strategy—if you’re trading crypto derivatives, your background in equity options at Goldman is relevant; your MBA is not. Then present the strategy mechanics, risk controls, and portfolio construction rules.
Avoid the common mistake of leading with 10 slides of market opportunity before revealing what you actually do. Investors assume you know the market; they’re evaluating whether you can execute.
Step 3: Build Data Visualizations That Update Automatically
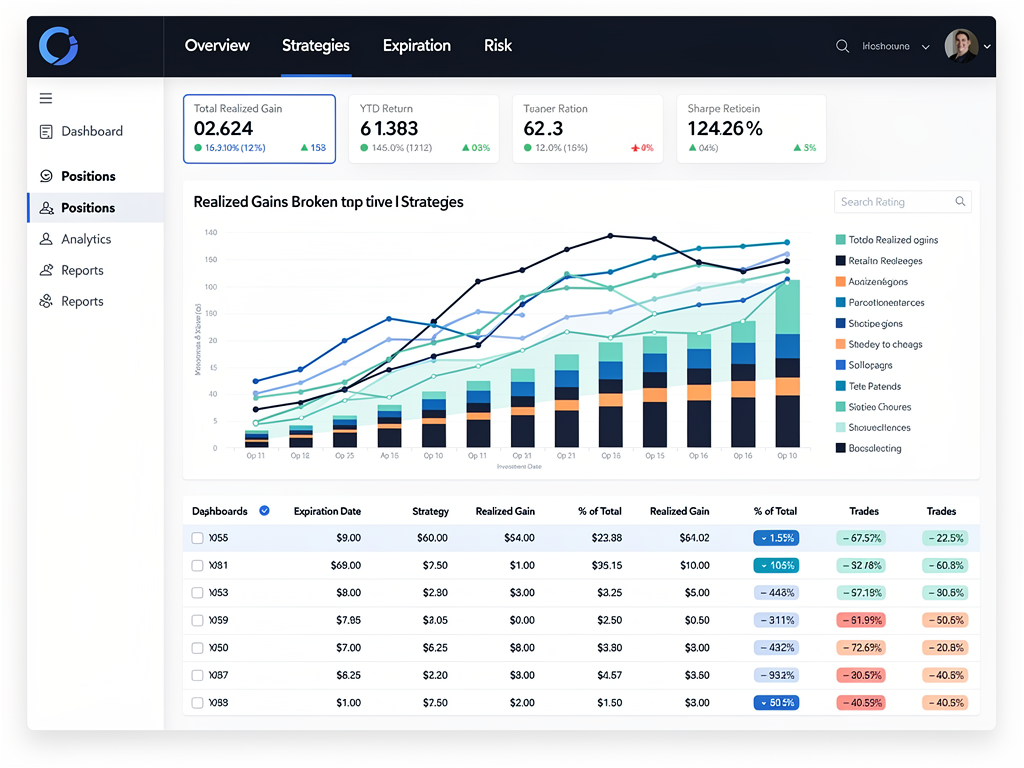
Static screenshots of performance tables are obsolete. Modern decks embed live dashboards or link to secure portals where investors can see real-time metrics. One manager built a Python-based system with 10,000+ lines of code that visualizes realized gains and losses by expiration date and strategy. The summary view made it easy to see, for example, that $87 million in realized gains came from contracts expiring in August, with a clear breakdown between synthetic and weekly positions. This became a favorite internal tool and a powerful investor communication asset.
If you don’t have engineering resources, tools like Tableau, Power BI, or specialized fund reporting platforms can connect to your prime broker feed and auto-refresh daily. The goal is to eliminate the “trust me, our returns are good” problem by letting allocators verify performance themselves.
Step 4: Detail Your Risk Management Framework
This is where most emerging managers stumble. You need specific numbers: maximum position size as a percentage of NAV, stop-loss rules, leverage limits, liquidity reserves, and counterparty exposure caps. Include a table showing historical drawdowns, recovery time, and what actions you took during those periods. If you haven’t experienced a drawdown, show simulated stress test results.
One operational AI implementation achieved 95% accuracy in decision-making and optimized 49 million transactions globally by embedding risk checks at every step. That level of precision—and the willingness to measure it—signals to allocators that you take risk seriously.
Step 5: Present Fee Structure and Terms Transparently
Don’t hide your 2-and-20 (or whatever your structure is) on slide 18. Put it on slide 5 or 6, alongside hurdle rates, high-water marks, and lock-up periods. Allocators will find it anyway, and burying it makes you look evasive. If your fees are higher than average, justify them with performance data or unique access (e.g., proprietary deal flow, exclusive data sets).
Emerging managers sometimes try to soft-pedal fees by lumping them into a “terms” appendix. This backfires. Institutional investors respect clarity.
Step 6: Include a Clear Call-to-Action and Next Steps
End with a one-page roadmap: “To proceed, we’ll schedule a 45-minute deep-dive call, provide access to our live performance portal, share DDQ responses, and introduce you to our third-party administrator and legal counsel.” Give them a calendar link or a single point of contact. The worst decks end with “Thank you for your time” and no path forward.
Automated systems can even generate follow-up emails and track engagement in a database for iteration, ensuring no prospect falls through the cracks.
Step 7: Test the Deck with Non-Investors First
Before you pitch a $50 million family office, present to a peer fund manager, a consultant, or a mentor who will give brutal feedback. Ask them to summarize your thesis after reading only the first three slides. If they can’t, restructure. One automation workflow logs every deck output and investor response, making it easy to A/B test slide order, data presentation, and narrative framing over dozens of iterations.
Where Most Projects Fail (and How to Fix It)
The biggest failure is treating the deck as a one-time project instead of a living document. Markets shift, performance updates monthly, and regulatory requirements change. Managers who lock their deck in January and use the same version in June are presenting stale data. Set a calendar reminder to refresh performance metrics, update team bios (new hires, certifications), and revise market opportunity slides every quarter. Better yet, use automated reporting that pulls fresh data from your prime broker or admin platform daily.
Another critical mistake is over-designing at the expense of content. Slick graphics and custom illustrations look impressive, but if your investment thesis is buried under visual clutter, allocators will disengage. One manager spent $5,000 on agency design and got a beautiful deck that didn’t answer basic questions about strategy mechanics or risk controls. Clarity beats aesthetics every time. Use clean templates, standard fonts, and data visualizations that are immediately interpretable.
Omitting regulatory disclosures is a fast track to legal trouble. Every deck must include risk warnings, disclaimers that past performance doesn’t guarantee future results, and statements that the material is not an offer to sell securities. If you’re marketing under Reg D, include the appropriate language. If you’re targeting non-U.S. investors, ensure compliance with local regulations. Managers who skip this because “it’s just a marketing doc” expose themselves to SEC enforcement or investor lawsuits down the line.
Many managers also fail to tailor the deck to their audience. A presentation for a pension fund should emphasize risk-adjusted returns, portfolio diversification, and ESG considerations. A pitch to a high-net-worth individual might focus on tax efficiency and liquidity options. Using a one-size-fits-all approach signals that you don’t understand your investor base. Create core content, then build modular sections you can swap in or out depending on the meeting.
Finally, ignoring the power of third-party validation is a missed opportunity. Include logos of your prime broker, auditor, legal counsel, and administrator. If you have institutional seed capital or backing from a recognizable name, feature it prominently. Allocators trust verified claims over self-reported data. When teams realize they need expert guidance to navigate compliance, data presentation, and investor psychology, specialized partners can accelerate the process. FLEXE.io, with over 7 years in Web3 marketing and a client base of 700+ projects, offers access to 150+ media outlets and 500+ KOLs to help funds build credibility and reach the right investors quickly. Reach out on Telegram: https://t.me/flexe_io_agency
Real Cases with Verified Numbers
Case 1: AI-Powered Deck Automation for Series A Founders
Context: A workflow automation builder created a system for Series A founders who were spending 3 weeks manually building investor pitch decks in PowerPoint or paying agencies $3,000 to $5,000 for generic templates. The goal was to reduce time, cost, and dependency on designers while producing investment-grade presentations.
What they did:
- Built a form trigger to collect five strategic company inputs and activate the workflow automatically.
- Deployed a market research agent to analyze TAM, SAM, SOM, and conduct competitive intelligence.
- Created a go-to-market strategy builder that generated actionable growth roadmaps with ICP definitions.
- Integrated Gamma to auto-render investor-grade presentations based on research and strategy outputs.
- Set up auto-export to Google Drive and automated investor email generation.
- Logged every output in a tracking database to manage iterations and measure performance.
Results:
- Before: 3 weeks of manual PowerPoint work, $3,000–$5,000 agency fees per deck, slow fundraising cycles dependent on designer availability.
- After: 12-minute generation time, $0.87 cost per deck, 24/7 operation with no human oversight, and $15,000+ worth of market research built into every presentation.
- Growth: The system generated $127,000 in revenue in one quarter, according to project data, and is now used by founders raising Series A rounds.
Key insight: Automation didn’t just save time—it embedded strategic research into every deck, giving founders a competitive edge over generic templates.
Source: Tweet
Case 2: Operational AI Delivering Measurable Efficiency Gains
Context: A financial services organization implemented AI across operations to improve productivity, reduce trading costs, and enhance decision accuracy. The goal was to build a compelling business case with measurable ROI for stakeholders and investors.
What they did:
- Deployed AI tools to automate repetitive processes and optimize workflows across the organization.
- Measured time savings, cost reductions, and accuracy improvements across trading and voting decisions.
- Optimized 49 million transactions globally using AI-driven decision-making.
- Tracked performance metrics to create a data-backed narrative for internal and external presentations.
Results:
- Before: Baseline productivity and trading costs without AI-driven optimization.
- After: 20% productivity increase (213,000 hours saved annually), $100 million in trading cost savings, 95% accuracy in voting decisions.
- Growth: The measurable results created a clear, compelling business case that could be presented to investors and board members.
Key insight: Quantifying operational improvements with specific hours saved, dollars reduced, and accuracy percentages turns abstract AI claims into investor-ready proof points.
Source: Tweet
Case 3: Python-Driven Performance Dashboard for Fund Managers
Context: A fund manager tracking yieldmax trading strategies needed a way to visualize realized gains and losses by expiration date and strategy. The goal was to create transparency into what drives fund performance and communicate it clearly to internal teams and investors.
What they did:
- Developed a website with over 10,000 lines of Python code to aggregate and display fund data.
- Built a summary view that breaks down realized profits and losses by contract expiration date and strategy type (synthetic vs. weekly positions).
- Designed multiple data-slicing options to let users explore performance drivers from different angles.
- Prepared the platform for investor access, providing real-time transparency into portfolio mechanics.
Results:
- Before: No integrated, real-time view of fund performance; limited ability to explain performance drivers to investors.
- After: Clear, visual breakdown showing, for example, $87 million in realized gains from contracts expiring in August, with detailed attribution to strategy types.
- Growth: Enhanced visibility into performance drivers, making it easier to communicate fund mechanics and build investor confidence.
Key insight: Investors trust detailed, verifiable breakdowns more than high-level summaries—showing exactly where alpha comes from builds credibility.
Source: Tweet
Case 4: Real-Time Marketing Dashboard Transforming Ad Decisions
Context: A marketing agency client was managing $940,000 in monthly ad spend but making decisions based on scattered data from Facebook Ads Manager, Google Sheets, and manual reports. The team had no real-time visibility and was reacting to problems days after they occurred.
What they did:
- Built a custom Meta Ads dashboard that tracked spend, sales, ROAS, and cost per acquisition in real time.
- Added predictive analytics to monitor metric trends, spend vs. conversions, click performance, and cost per impression.
- Integrated audience intelligence showing top-performing age groups, device breakdown, gender performance, and geographic targeting.
- Automated data updates so insights refreshed every hour instead of waiting for weekly manual reports.
- Discovered that the 25–34 age group was outperforming all others and shifted 60% of budget there; found that mobile was driving 80% of conversions and optimized all creatives for mobile-first.
Results:
- Before: 6 hours weekly pulling manual reports, decisions made on 2-day-old data, burning budget on underperforming segments.
- After: 10 minutes daily reviewing live insights, real-time data-driven decisions, catching issues within hours, optimizing budget automatically.
- Growth: 40% ROAS increase in the first month, 25% boost from mobile-first creative optimization, improved decision speed from weekly to daily cycles.
Key insight: Real-time dashboards beat gut feelings—visibility into what’s working right now allows for immediate optimization and eliminates costly lag time.
Source: Tweet
Tools and Next Steps
For deck creation, Gamma and Pitch are popular no-code platforms that generate clean, modern presentations quickly. If you need more control, Canva Pro or Adobe InDesign offer templates optimized for financial services. For automation, n8n (open-source workflow tool) or Zapier can connect your CRM, data sources, and reporting platforms to auto-update deck slides. Claude or GPT-4 can draft slide copy, conduct market research, and generate investor FAQs in minutes.
For performance tracking and data visualization, fund-specific platforms like Backstop, BarclayHedge, or Preqin provide institutional-grade reporting. If you’re building custom dashboards, Python libraries like Plotly, Dash, or Streamlit let you create interactive visualizations that pull live data from your prime broker or administrator. Tableau and Power BI are enterprise standards for real-time dashboards that non-technical teams can manage.
For compliance, work with a securities attorney experienced in Reg D, JOBS Act filings, or offshore fund formation. Use tools like Carta for cap table management and RIA in a Box for compliance documentation templates. Never rely on generic internet advice for regulatory language—one mistake can delay your fundraising by months.
When you need to scale distribution, connect with institutional networks, or access media and influencer channels that reach accredited investors and allocators, specialized marketing partners can accelerate your timeline. FLEXE.io has supported 700+ clients over 7 years in Web3 marketing, offering access to 10+ crypto traffic sources, 150+ media outlets, and 500+ KOLs to help funds grow awareness and attract the right LPs. Get in touch on Telegram: https://t.me/flexe_io_agency
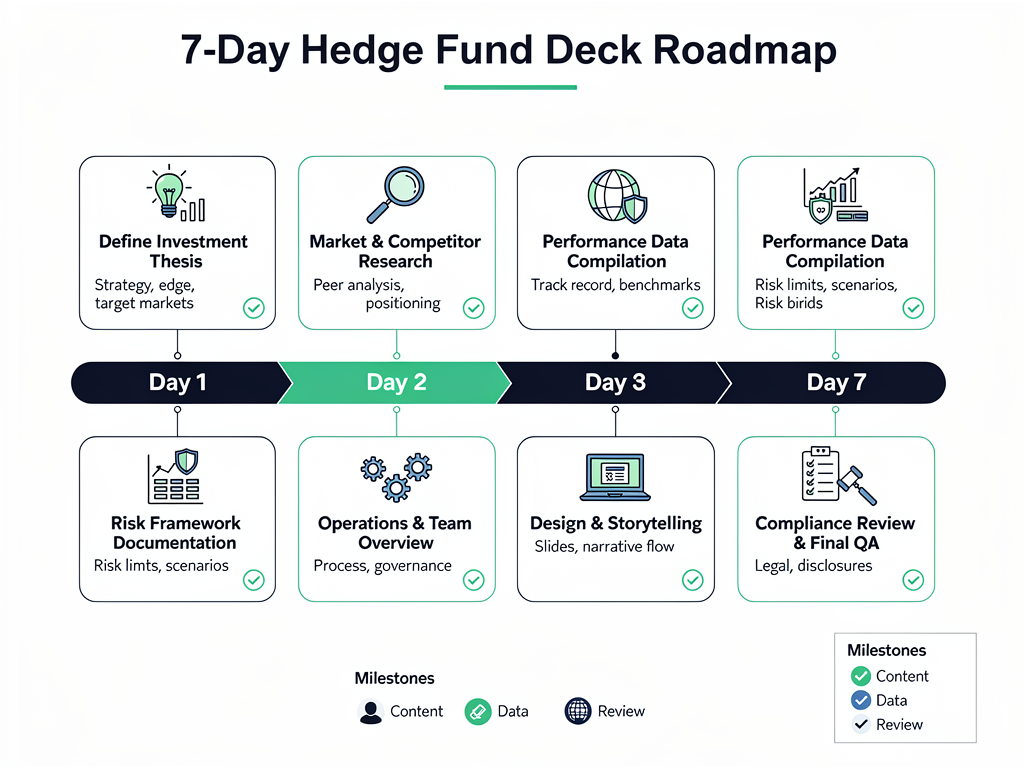
Checklist: Build Your Deck in 7 Days
- [ ] Write your one-sentence investment thesis and validate it with data (why it’s defensible and repeatable).
- [ ] Compile historical performance data, even if it’s a personal account or simulated backtest—label it clearly and include disclaimers.
- [ ] Draft team bios that highlight domain expertise directly relevant to your strategy (skip generic credentials).
- [ ] Map out your strategy mechanics: entry/exit rules, position sizing, hedging, portfolio construction (enough detail for an allocator to understand execution).
- [ ] Document your risk management framework: max position size, stop-loss rules, leverage limits, liquidity reserves, counterparty caps.
- [ ] Build or link to a live performance dashboard so investors can verify metrics themselves (even a simple Google Data Studio report works).
- [ ] Write clear, specific risk disclosures and disclaimers (work with a securities attorney to ensure compliance).
- [ ] Design a clean, text-focused slide deck (15–25 slides) using a professional template—avoid over-designing.
- [ ] Create a fee structure slide with management fees, performance fees, hurdle rates, high-water marks, and lock-up terms (no hiding this information).
- [ ] End with a clear call-to-action: “Schedule a deep-dive call, access our live portal, review our DDQ” with a calendar link or contact email.
- [ ] Test the deck with a peer, consultant, or mentor—ask them to summarize your thesis after reading the first three slides.
- [ ] Set a quarterly reminder to refresh performance data, update team bios, and revise market opportunity slides (or automate this with live data feeds).
FAQ: Your Questions Answered
How long should a pitch deck be?
Fifteen to twenty-five slides is the sweet spot. Institutional investors want enough detail to evaluate your strategy, risk controls, and team, but not so much that the core thesis gets buried. If you need more depth, put it in an appendix or a separate DDQ document.
Can I include simulated or backtested performance?
Yes, but you must label it clearly as hypothetical and include disclaimers that backtested results don’t reflect actual trading, market impact, or slippage. Many emerging managers start with simulated track records and transition to live performance once the fund launches. Transparency is critical—mislabeling hypothetical data as live performance is a regulatory violation.
What’s the best way to present historical returns?
Use a monthly or quarterly performance table with net returns (after fees), benchmark comparison, and drawdown data. Include a chart showing cumulative growth and maximum drawdown periods. If you have third-party verified performance from a previous role or separately managed account, feature that prominently with auditor or administrator attestation.
Do I need a compliance review before sharing the deck?
Absolutely. If you’re raising capital under Reg D or marketing to non-U.S. investors, you need proper disclaimers, risk warnings, and adherence to advertising rules. A securities attorney should review your deck before it goes out. Skipping this step can result in SEC enforcement, investor lawsuits, or disqualification from institutional allocator programs.
How often should I update my presentation?
At minimum, quarterly. Performance data should be as current as possible—showing January returns in a June pitch signals either negligence or underperformance. If you have live dashboards, link to them so investors always see real-time metrics. Also update team bios when you hire senior talent, adjust strategy descriptions if you shift focus, and revise market opportunity slides as conditions change.
What are the most common reasons investors reject a deck?
Unclear investment thesis (they can’t summarize your edge after reading three slides), lack of verifiable performance data, generic competitor analysis, missing or vague risk disclosures, and over-reliance on design instead of substance. Institutional allocators are evaluating hundreds of managers; if you don’t make the case quickly and clearly, they move on.
Should I use video or interactive elements?
Video intros can work for initial outreach, but most institutional investors prefer PDF or live presentation formats for detailed review. Interactive dashboards embedded via links (using Tableau, Power BI, or custom platforms) are powerful because they let allocators explore your data themselves. Just ensure they’re secure, mobile-friendly, and load quickly. Avoid gimmicks like animated transitions or auto-play videos—they distract from content and slow down review.