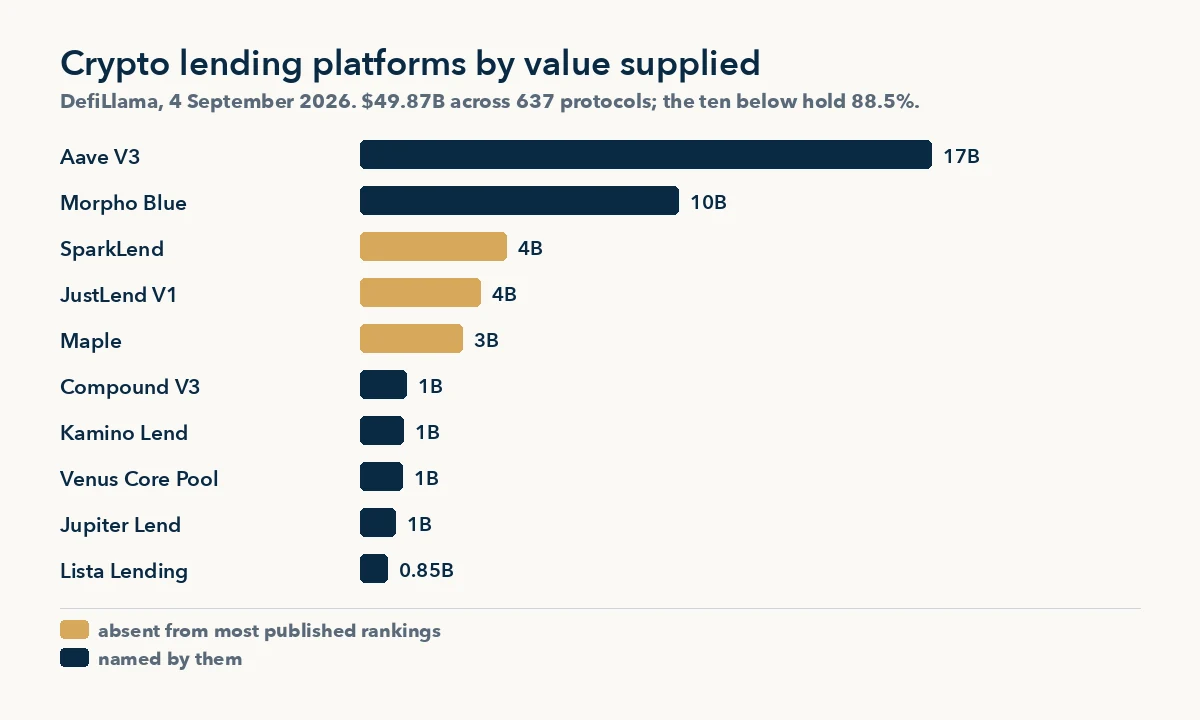
The best crypto lending platforms in 2026 by value supplied are Aave V3 ($17.35 billion, 34.8% of the market), Morpho Blue ($9.66 billion across 42 chains), SparkLend ($4.44 billion), JustLend ($3.66 billion on Tron alone) and Maple ($3.11 billion in institutional credit). The figures come from DefiLlama’s lending category, which held $49.87 billion across 637 protocols when we read it on 4 September 2026.
The ten largest hold $44.14 billion, or 88.5% of the market. The third and fourth largest, SparkLend and JustLend, hold $8.10 billion between them and appear on almost none of the published rankings.
What are crypto lending platforms
A crypto lending platform lets you supply assets that others borrow against collateral, and pays you the interest those borrowers are charged. In DeFi the whole cycle runs through smart contracts: collateral is priced by an oracle, and a position that falls below its liquidation level is closed automatically.
Not every platform in this market works the same way. Most are over-collateralised money markets, pooled or isolated, while a smaller part underwrites borrowers and asks lenders to carry credit risk. The model column in the table below matters more than the headline size, because it decides what can go wrong.
The best crypto lending platforms in 2026, ranked by value supplied
1. Aave V3 (DeFi, 21 chains)
Aave V3 holds a third of the category on its own. Pooled markets with governed parameters remain the default design, and the default still holds more than the next two protocols combined.
- Value supplied: $17.35 billion, 34.8% of the category
- Best for: the deepest liquidity in DeFi lending
- Why it stands out: leads by size from 21 chains
- Watch out: governance can change the parameters of a market you are already in
2. Morpho Blue (DeFi, 42 chains)
Morpho Blue is second by size and first by reach. Each market sits in isolation, so adding a chain adds markets rather than diluting one pool, and curated vaults sit on top of them.
- Value supplied: $9.66 billion, 19.4% of the category
- Best for: isolated markets and curated vaults
- Why it stands out: live on 42 networks, more than any other top protocol
- Watch out: each market carries whoever configured it, so check the curator
3. SparkLend (DeFi, 2 chains)
SparkLend is the pooled lending market of the Sky ecosystem. It is third by size and missing from almost every published ranking.
- Value supplied: $4.44 billion, 8.9% of the category
- Best for: users already inside the Sky ecosystem
- Why it stands out: a top-three protocol that coverage leaves out
- Watch out: pooled design, so governance decisions reach every supplier
4. JustLend (DeFi, Tron)
JustLend V1 is fourth largest from a single chain and effectively invisible in English-language coverage of DeFi lending. Size does not require reach, and coverage does not follow size.
- Value supplied: $3.66 billion, 7.3% of the category
- Best for: lending and borrowing on Tron
- Why it stands out: the largest single-chain protocol in the top ten
- Watch out: all of its risk sits on one network
5. Maple (institutional credit, 2 chains)
Maple is not a retail money market. It underwrites borrowers, so a lender there takes credit risk on a counterparty rather than relying on over-collateralisation and liquidation.
- Value supplied: $3.11 billion, 6.2% of the category
- Best for: lenders who want underwritten credit exposure
- Why it stands out: institutional credit is now a visible line in DeFi lending
- Watch out: there is no liquidation engine, only repayment or recovery
6. Compound V3 (DeFi, 10 chains)
Compound V3 runs single-borrow-asset markets: each market lends one asset against a set of collateral types, which keeps the risk in each market easy to read.
- Value supplied: $1.41 billion, 2.8% of the category
- Best for: a simple borrow market with one debt asset
- Why it stands out: a clear design on 10 chains
- Watch out: published summaries quote it at $1.15 to $1.8 billion, so read the source
7. Kamino Lend (DeFi, Solana)
Kamino Lend is the larger of the two Solana protocols in the top ten. Together with Jupiter Lend it holds $2.38 billion, a second market rather than a rounding error.
- Value supplied: $1.31 billion, 2.6% of the category
- Best for: pooled lending on Solana
- Why it stands out: the larger of the two Solana entries in the ranking
- Watch out: single chain, so network outages affect every position
8. Venus Core Pool (DeFi, 8 chains)
Venus Core Pool started on BNB Chain and now runs on eight networks as a pooled market.
- Value supplied: $1.28 billion, 2.6% of the category
- Best for: pooled lending with BNB Chain roots
- Why it stands out: wide reach for its size, on eight networks
- Watch out: read the liquidation settings per collateral asset, not the headline ones
9. Jupiter Lend (DeFi, Solana)
Jupiter Lend is the second Solana protocol in the ranking, also pooled and also on one chain.
- Value supplied: $1.07 billion, 2.2% of the category
- Best for: pooled lending on Solana
- Why it stands out: the second Solana entry in the top ten
- Watch out: check how much of each pool is already lent out before depositing
10. Lista Lending (DeFi, 2 chains)
Lista Lending closes the top ten with pooled markets on BNB Chain.
- Value supplied: $0.85 billion, 1.7% of the category
- Best for: pooled lending on BNB Chain
- Why it stands out: the last protocol inside the top ten
- Watch out: smaller markets mean your own exit can move the rate
| Platform | Supplied value | Share | Chains | Model |
|---|---|---|---|---|
| Aave V3 | $17.35B | 34.8% | 21 | Pooled, governed markets |
| Morpho Blue | $9.66B | 19.4% | 42 | Isolated markets, curated vaults |
| SparkLend | $4.44B | 8.9% | 2 | Pooled, Sky ecosystem |
| JustLend V1 | $3.66B | 7.3% | 1 | Pooled, Tron only |
| Maple | $3.11B | 6.2% | 2 | Institutional credit |
| Compound V3 | $1.41B | 2.8% | 10 | Single-borrow-asset markets |
| Kamino Lend | $1.31B | 2.6% | 1 | Pooled, Solana |
| Venus Core Pool | $1.28B | 2.6% | 8 | Pooled, BNB origin |
| Jupiter Lend | $1.07B | 2.2% | 1 | Pooled, Solana |
| Lista Lending | $0.85B | 1.7% | 2 | Pooled, BNB |
If you run a project here, not just research one: Lending is a trust category: deposits follow reputation, not APY. We build that reputation in the outlets your depositors actually read, and we will tell you which placements do nothing. PR placements in crypto media.
How crypto lending platforms work
The top ten split into three models, and the model decides how risk is partitioned. Pooled markets (Aave V3, SparkLend, JustLend, Kamino, Venus, Jupiter, Lista) put many assets into shared pools with parameters set by governance. Isolated markets (Morpho Blue, and in a narrower form Compound V3) keep each market separate, so risk stops leaking between them. Underwritten credit (Maple) lends to vetted borrowers instead of relying on liquidation.
Before supplying, read the risk parameters rather than the rate. Start with the oracle: which price source the market uses for your collateral, how often it updates and what happens if it stops. Then read the liquidation settings for the exact collateral you plan to post. The gap between the borrow limit and the liquidation level is the room you have to react, and the liquidation penalty decides how much of the position disappears when that level is touched.
The quoted rate comes last, and it should be split before it is compared. Part is paid by borrowers and part, often most of it in a new market, is paid in tokens the protocol distributes on a schedule. Only the first part survives the programme. A rate that cannot be split into those two pieces is a marketing number.
DeFi vs CeFi lending: which should you choose
DeFi lending publishes its numbers on-chain. Every figure in this ranking, from supplied value to the parameters of each market, can be read by anyone from the contracts or from a tracker. That is why centralised lenders are not in the table: they publish no comparable on-chain figure, so putting them alongside would mean ranking audited numbers against marketing ones.
Choose DeFi if you want to verify where your assets sit and under which rules, and you are willing to watch a position yourself. A CeFi lender asks you to trust its own reporting instead. Keep one practical point in mind either way: assets held on an exchange that suspends withdrawals during volatility are not available to defend a DeFi position, however real the balance looks.
Within DeFi, the more useful choice is pooled or isolated. In pooled designs, governance can alter a market you are already in, so find the timelock between a passed proposal and its execution and who holds the emergency keys. In isolated designs, check who created the market and what they put behind it: in a permissionless market list, the name on the market is as much a counterparty as the protocol.
Risks and safety checks
Supplied value measures where capital sits, not what it earns or what it risks. A protocol can be large because it is safe or large because it is old. These checks decide whether a market suits you:
- Collateral quality. Wrapped and yield bearing collateral carries the risk of whatever produces it. Check where the asset is redeemable, on what timetable, and whether the oracle prices it directly or by a conversion rate that would lag a redemption problem.
- How much is lent out. A market lent out to the edge of its capacity pays well and may not let you leave until borrowers repay or new deposits arrive.
- Your share of the market. Being a large share of a single market means your own exit moves the rate against you. Size against the market, not your portfolio.
- Test first. Take a small position through supply, borrow, repay and withdraw before committing anything that matters.
- Alerts, not habits. Set alerts for a health figure nearing your own threshold, a change in how much is lent out, a governance proposal touching your collateral, and any pause reported by the team.
In a cascade, read your position from the protocol’s own contracts rather than a front end showing a cached figure, and send the transaction that reduces risk first. Repaying part of the debt is usually faster than topping up collateral you first have to acquire. Afterwards, read what the protocol published about bad debt: a team that states the size of the hole and the plan for it behaves differently from one that changes the subject.
Underwritten credit needs different checks. You are asking who the borrowers are, what the underwriter discloses, what has defaulted before and what happened to lenders in that case. Over-collateralised habits do not carry across.
Market trends in 2026
Published ranges are too wide to use. Summaries circulating in September 2026 give Aave V3 a range of roughly $14.4 to $76.6 billion, a factor of five quoted as a fact, against a tracked $17.35 billion. A range that wide usually merges two quantities: total value ever supplied against value supplied now, or all deployments against one.
Two opposite bets on chains. Morpho Blue spans 42 networks, JustLend holds $3.66 billion on one, and Aave V3 sits between them at 21. Reach and size are only loosely related.
Solana is a second market. Kamino Lend and Jupiter Lend hold $2.38 billion between them. For a project deciding where to seed borrow demand, that matters.
Credit sits beside collateral. Roughly 6% of the $49.87 billion total is credit-underwritten and most of the rest is over-collateralised, and the two behave differently when prices move fast. The same boundary problem appears in the ranking of the biggest stablecoins by supply, where tokenised Treasury funds share a table with payment stablecoins.
How this ranking was built
Order is set by value supplied to each protocol, as reported by DefiLlama in its lending category on 4 September 2026. That category held 637 protocols and $49.87 billion. Chain counts are the networks each protocol was live on at that date, and the model column describes how risk is partitioned.
Centralised lenders are excluded for the reason above. Rates, liquidation parameters and oracle design are excluded too: they decide whether a market is safe, and none of them reduces to one number. Supplied value responds to rates within days, so re-read the source rather than this table if a decision depends on it. If you are launching a lending product rather than using one, see our notes on DeFi marketing by protocol type and the list of the top 30 decentralized exchanges.
Frequently Asked Questions
What are the best crypto lending platforms in 2026?
By value supplied, Aave V3 leads with $17.35 billion, 34.8% of the category, followed by Morpho Blue at $9.66 billion and SparkLend at $4.44 billion. JustLend and Maple complete the top five. The ten largest held $44.14 billion of a $49.87 billion market across 637 protocols on 4 September 2026.
How big is the DeFi lending market?
DeFi lending held $49.87 billion supplied across 637 protocols on 4 September 2026, and the top ten held 88.5% of it. Centralised lenders are not included, because they publish no comparable on-chain figure, so any total that mixes both combines audited numbers with self-reported ones.
Why do Aave TVL numbers differ so much?
Because sources merge different quantities. Ranges of $14.4 to $76.6 billion appear in September 2026 summaries against a tracked $17.35 billion. A spread that wide usually mixes cumulative supply with current supply, or all deployments with one. A current figure is a single number with a date attached.
Is a lending protocol on more chains bigger?
Not reliably. Morpho Blue spans 42 networks and is second at $9.66 billion, but JustLend holds $3.66 billion on Tron alone and ranks fourth. Aave V3 leads the category from 21 chains. Reach and size are only loosely related, and the model matters more than the count.
Is crypto lending always over-collateralised?
No. Maple, at $3.11 billion or about 6% of the total, underwrites borrowers instead, so a lender there carries counterparty credit risk rather than relying on liquidation. Reading the whole $49.87 billion as one comparable pool hides that difference, and the two models behave differently when prices move quickly.
Related reading
For where borrowed collateral is sourced and routed, see our ranking of DEX aggregators by routed volume.